The User Metrics Page has valuable information that will better help you understand how your employees are using Anthill.
Table of Contents
Total Subscribers, Unsubscribed, and Resubscribed
Topline Metrics
At the top of the User Metrics page, you will find four topline metrics:
- Total Number of Employees
- The total number of employees ever uploaded to your Anthill Dashboard. Billing is based on this number.
- Average Messages within Open Tickets
- For all open tickets, the average number of total messages. This is broken down by inbound and outbound messages as well.
- Average Messages within Resolved Tickets
- For all closed tickets, the average number of total messages. This is broken down by inbound and outbound messages as well.
- Average Messages within Autoresolved Tickets
- For any messages that go through an Autoreply, the average number of total messages before the ticket is closed.
- For any messages that go through an Autoreply, the average number of total messages before the ticket is closed.
Note: Autoreply Setting will send a follow-up message to confirm that the end-users issue was resolved so we expect the Average Messages within Autoresolved Tickets to be, at minimum, two.
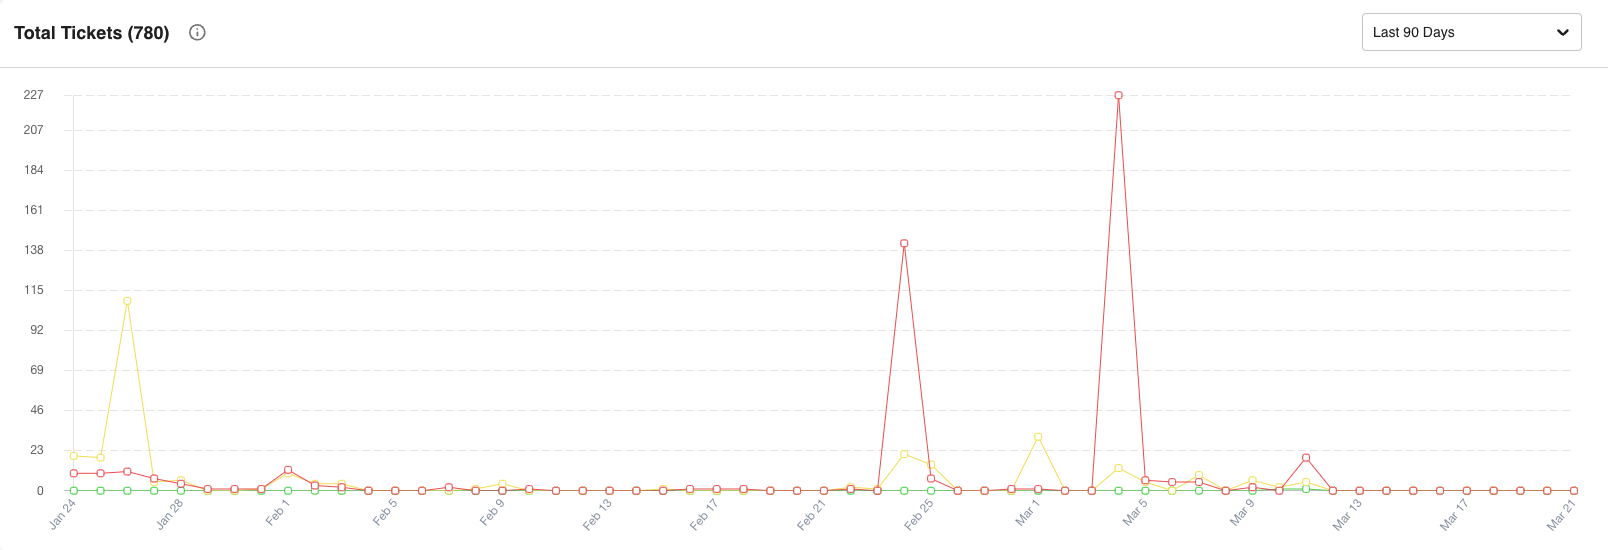
Total Tickets
Total Tickets graphs the number of tickets over time broken down by Open (red), Resolved (yellow), and Autoresolved (green). Hover over the points to see details for each day. The total count of tickets is displayed at the top of the graph. You can adjust the timeframe in the upper right corner.
Total Number of Posts
Total Number of Posts graphs the number of announcements.
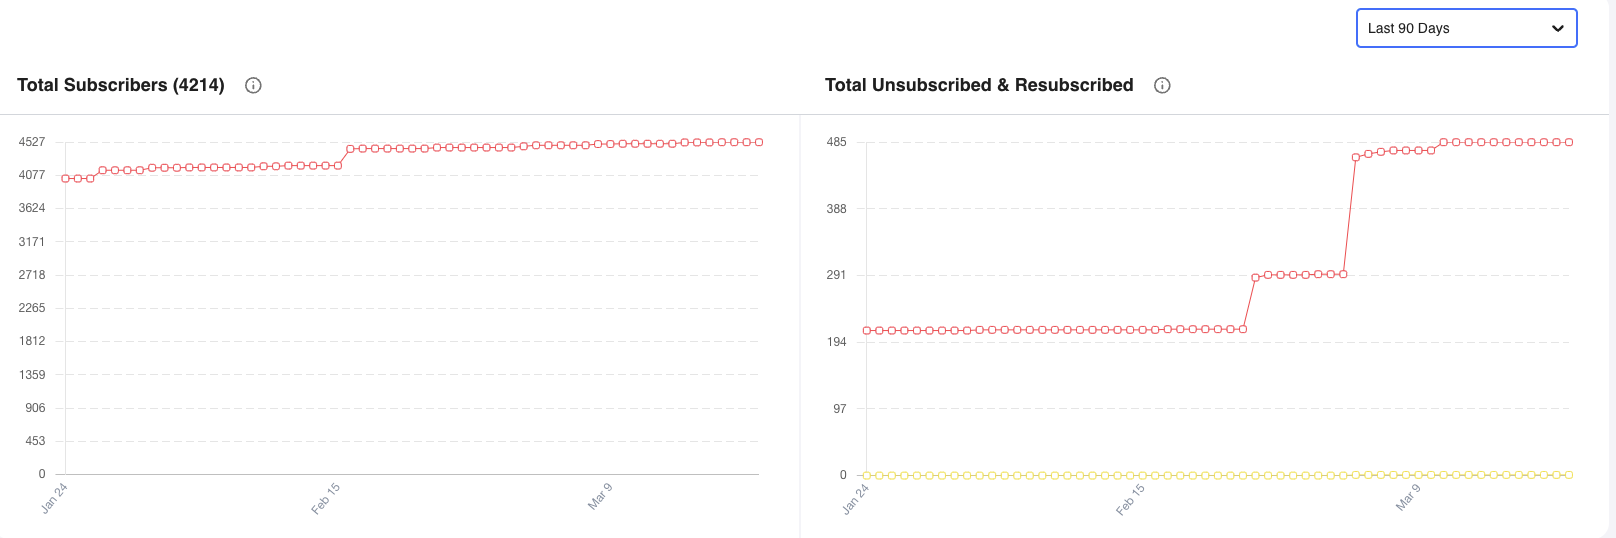
Total Subscribers, Unsubscribed, and Resubscribed
Total Subscribed and Total Unsubscribed & Resubscribed graph the number of subscribed users over time. Subscribed users are those receiving texts while unsubscribed (red) have opted out. When an unsubscribed (yellow) user opts back in, they are counted as Resubscribed. Hover over the points to see details for each day. The total count of Subscribers is displayed at the top of the graph. You can adjust the timeframe in the upper right corner.